Predictability
Forecasting vs Predictability
Forecasting is a statement about some future outcome or event yet unknown, within some agreed level of uncertainty, that is verifiable against future outcomes. How you model assumptions is at the heart of forecasting
Predictability is about behaviors that can be anticipated within an agreed degree of reliability. How you model data is at the heart of predictability.
There’s little point in discussing forecasting without first establishing an acceptable degree of predictability. Let’s explore what that means.
The Economic Control of Software Product
We start with predictability to provide a better foundation for forecasting. Reliable predictive models and verifiable forecasts are invaluable tools to the people who are responsible for ensuring that the systems are worth more than what it cost to build them.
Units of Measure
Modeling predictability looks at batches of work items over time, starting with the study of Lead Time. The first thing to do is to set boundaries, to provide definitions to units of measures that serve as controls for predictability. They are not the “correct” definitions, there are none. They are the operational definitions that we choose to apply. If there’s a reason why any of these definitions need to be reframed to accomodate your purpose, that’s fine. The only requirement is that we set unambiguous boundaries and apply them consistently in gathering event data for analysis.
Operational Definitions

Lead Time: is the elapsed time between a new item’s appearance in our workflow and its final departure from the system. Accelerate uses this definition: from the time it takes to go from a customer making a request to the request being satisfied.
Entry Criteria should align with the point when customer can legitimately expect us to work on on an item.
Exit Criteria: When the work exits the system should correspond to the point when service is afforded or provided to the customer.
Operational Lead Time is the elapsed time that the work is being actively worked on. “Cycle Time” is a synonym for Operational Lead Time.
Entry Criteria aligns with the item going into in-progress state
Exit Criteria aligns with the item being included in a release to a production like environment
Time on Task (or Work Time) is the elapsed time an item spends in a work state, excluding wait (queue) states.
Entry Criteria coincides with the start of Operational Lead Time but pauses when work enters any queue state. It resumes whenever work enters any active status.
Exit Criteria coincides with the end of Operational Lead Time.
Takt Time is the rate at which you need to complete work in order to meet customer demand
Takt Time is the total available production time divided by available capacity

The purpose of the data gathered by this process is to support the calculation of the following
WIP — Work In Progress is the number of items in the currently in the system. Operational Lead Time WIP will necessarily be a subset of Lead Time WIP
Throughput — Throughput is then number of items completed per unit of time
Flow Efficiency — is the percentage of time that an item spends in valuable, value-adding activities verses total Lead Time.
Flow efficiency is calculated as Work Time divided by Lead Time times 100%
Flow Efficiency
The concept of waste elimination in traditional value stream mapping practice literature is always cast as muda: non-value-adding activities. To understand the significance of the prioritization of muda, we need to look at it from the perspective of flow efficiency.
In the contemporary manufacturing domain, time on task, or takt time, is high, above 90% in many competitive industries. In knowledge work domains, 5% would be a good aspirational target for many organizations. The reasons for that are a topic for another day. The point here is that at low flow efficiencies, increasing rate of flow just a little bit is often the most cost effective way of improving throughput. Improving throughput is an optimization that creates more value. By prioritizing muda in the knowledge work domain, you are optimizing where your costs aren’t.
Annie Spratt — "Man archery bow and arrow"
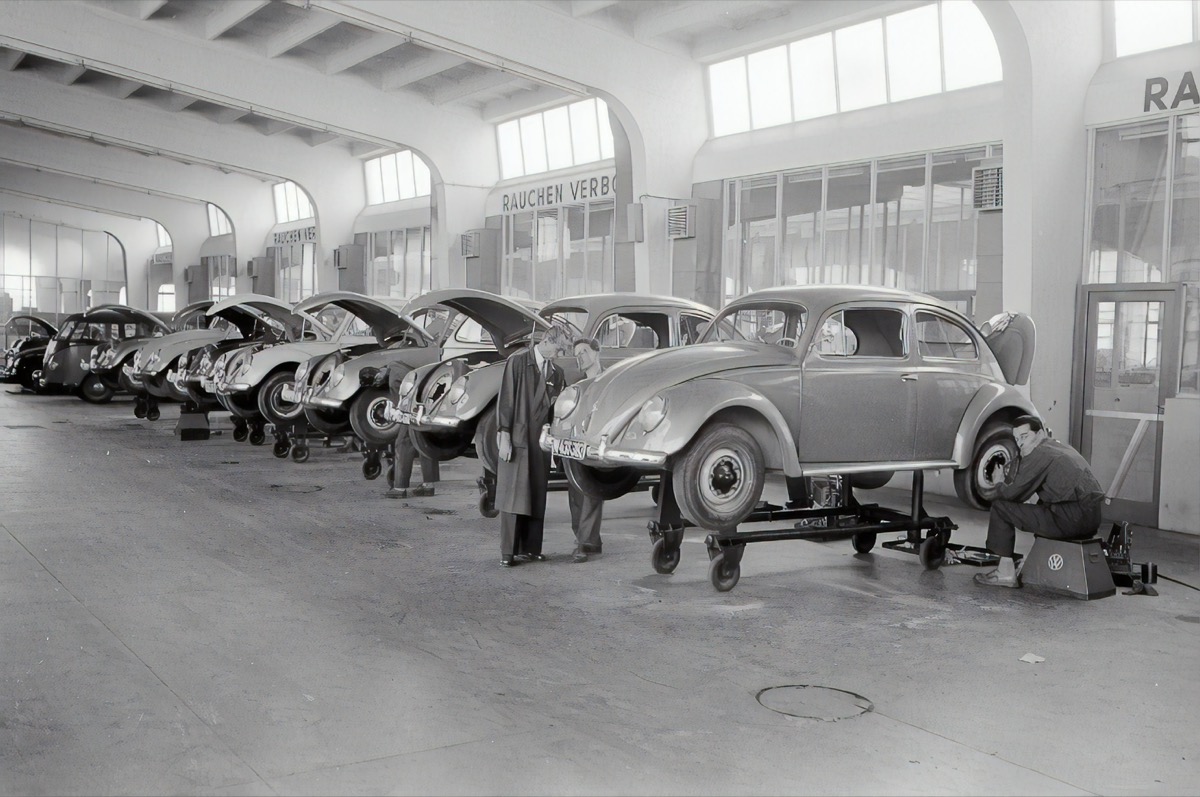
Austrian National Library — "Volkswagon Service Center"
Echo Wang — "Norweigan River"

Let's agree to define productivity in terms of throughput. We can debate the meaning of productivity in terms of additional measurements of the business value of delivered work, but as Eliyahu Goldratt pointed out in his critique of the Balanced Scorecard, there is a virtue in simplicity. Throughput doesn’t answer all our questions about business value, but it is a sufficient metric for the context of evaluating the relationship of practices with productivity.